Here is a definition of a Rational Function:
-A function that is the ratio of two polynomials but the polynomial you are dividing cannot be by 0.
-The equation below is rational because one is being divided by the other, like a ratio.
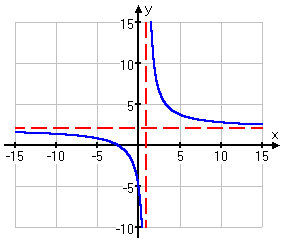
-To graph a rational function, you first need to find the asymptotes and intercepts, plot a few points, then sketch the graph.
Graph the following:
Vertical Asymptote:
- x – 1 = 0
x = 1
Horizontal Asymptote:
y = 2/1
= 2
y=2
- You need to then plot the asymptotes with dashed lines on the graph.
X-Intercept:
x = 0: y = (0 + 5)/(0 – 1) = 5/–1 = –5
X=-5
Y-Intercept:
0 = 2x + 5
–5 = 2x
–2.5 = x
- Now I'll pick a few more x-values, compute the corresponding y-values, and plot a few more points.
| x |
y = (2x
+ 5)/(x – 1)
|
| –6 |
(2(–6) + 5)/((–6)
– 1) = (–12 + 5)/(–7) = (–7)/(–7) = 1
|
| –1 | (2(–1) + 5)/((–1) – 1) = (–2 + 5)/(–2) = (3)/(–2) = –1.5 |
| 2 | (2(2) + 5)/((2) – 1) = (4 + 5)/(1) = (9)/(1) = 9 |
| 3 | (2(3) + 5)/((3) – 1) = (6 + 5)/(2) = (11)/(2) = 5.5 |
| 6 | (2(6) + 5)/((6) – 1) = (12 + 5)/(5) = (17)/(5) = 3.4 |
| 8 | (2(8) + 5)/((8) – 1) = (16 + 5)/(7) = (21)/(7) = 3 |
| 15 | (2(15) + 5)/((15) – 1) = (30 + 5)/(14) = (35)/(14) = 2.5 |
- -Here is what the graph looks like with the plotted points:
-Here is what the graph should look like:


No comments:
Post a Comment